

Some of you thought we were out of the woods when the stock market rebounded after a big crash last month. But let me remind you: the stock market is not the economy. While a temporary rally might give investors hope, the deeper economic indicators are telling a different, more worrying story.
We've been sounding the alarm for months, and now, with recent data continuing to paint a bleak picture, it's time to take a hard look at what's really going on under the surface.

Hey, it's Justin Hart. This is my final call for those who want to take advantage of our special pricing for annual subscriptions to Rational Ground.

I am immensely grateful for all of our subscribers, whether free or paid, and I hope to bring you immense value in return.
As you may have seen we've been putting together a host of new tools, including some great A.I. chat features for quickly searching through a bunch of data on Covid and the economy.
We're also putting together a downloadable Excel file so that you can track things and get the data that you need to keep informed for the election!
Here are some critical metrics you should be paying attention to:
1. Commodities Are Falling Fast
Commodities are some of the best early indicators of economic health, and right now, they're sending out red flags:
Oil Prices: WTI crude oil has fallen below $70 per barrel and is now hovering around $60. This is a far cry from the highs we saw earlier this year, signaling lower global demand (ICIS).
Gasoline Prices: Wholesale gasoline prices have also plummeted, reaching $1.95, the lowest since April 2021. Low gas prices may seem like a relief at the pump, but they’re often a sign of declining economic activity, as lower demand drags down prices.
Refiner Margins: Estimated to be at a 3.5-year low—Big Oil isn’t thrilled, which should tell you something about where we’re headed. (EIA)
2. The Copper/Gold Ratio

The Copper/Gold Ratio is a key economic barometer that compares the price of copper, an industrial metal, to gold, a traditional safe-haven asset. When the ratio falls, it suggests that industrial demand is weakening and investors are fleeing to safety:
As of August 2024, the ratio has dropped to 0.22, down from 0.31 in January (
XM Trading). This decline is a major red flag for the global economy, indicating lower confidence in industrial growth.

3. Swap Spreads: A Signal of Financial Distress
Swap spreads have long been used to assess credit risk in the financial system, and they’re flashing warning signs again. Though exact figures weren’t detailed in the latest reports, widening swap spreads typically mean that financial institutions are growing more cautious and less willing to lend.
Swap spreads explained to a child: Imagine you want to borrow money from a friend. Usually, they charge you a small fee (interest) because they trust you'll pay them back. But if they get worried you might not pay them, they'll ask for a bigger fee to feel safe.
Swap spreads are like that fee in the grown-up world of finance. When the fee (or spread) gets bigger, it means banks and investors are worried about lending money because they think something could go wrong in the economy. When the fee stays small, it means they're not so worried and feel safe lending money.
So, when swap spreads get bigger, it's a sign that people in finance are starting to get nervous about the future.
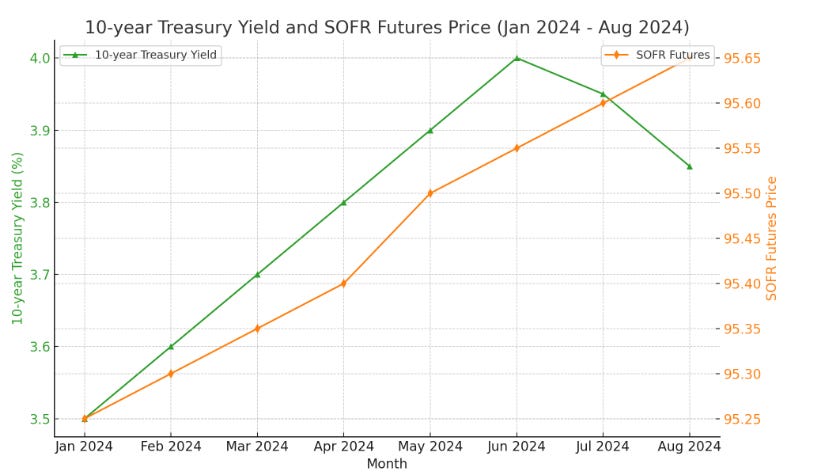
4. The Yield Curve and SOFR Futures
Market signals continue to predict a recession. Here's what to watch:
10-year Treasury Yield: The yield hit 4.0% in June 2024 before retreating slightly. This inversion, where long-term rates fall below short-term ones, is often seen as a precursor to recession (JPY).
SOFR Futures: Futures prices have risen to 95.65, reflecting market expectations that the Federal Reserve will have to cut rates in response to a weakening economy. This is further evidence that financial markets are bracing for trouble ahead.

What are SOFR Futures?
Imagine you're trying to predict the weather next week. If you think it might rain, you might plan to carry an umbrella. In finance, people try to predict what interest rates will be in the future, and SOFR Futures are a tool to do that.
SOFR (Secured Overnight Financing Rate) is a special interest rate used in big loans between banks. SOFR Futures are like a bet on what this interest rate will be at a certain time in the future. If investors think the economy will be in trouble, they might expect interest rates to go down, so the price of SOFR Futures goes up.
When people look at SOFR Futures, they can see what the market thinks will happen to interest rates, which can help everyone understand how worried or confident people are about the economy.
5. Central Banks are Cutting Rates Again
It’s not just the Federal Reserve that’s reacting to a weakening economy. The Bank of Canada has now cut rates for the third consecutive time in 2024 (XM Trading) (ICIS). When central banks start slashing rates, it’s a clear indication they’re deeply concerned about growth—and history shows rate cuts often signal deeper trouble ahead.
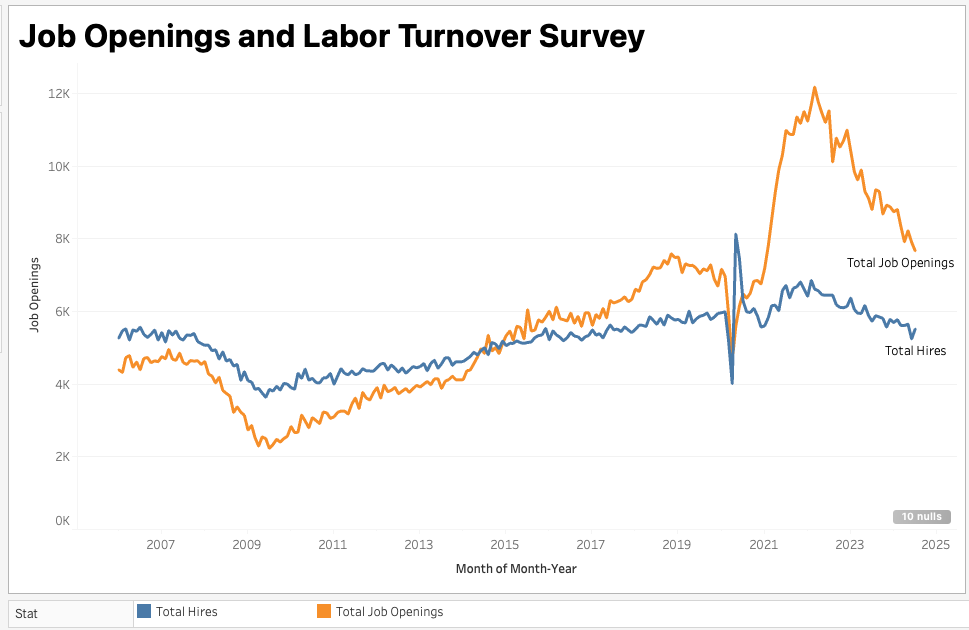
6. Labor Market Weakness: JOLTS Data
A weakening labor market is another sign that recession fears are justified:
Job Openings: According to the latest JOLTS (Job Openings and Labor Turnover Survey) data, job openings have fallen to 7.67 million in July 2024, down from 7.91 million in June.
Layoffs: Layoffs rose to 1.76 million, the highest level since March 2023. This suggests that employers are pulling back, anticipating tougher times ahead.
Hiring: Hiring remains weak, while quits (a measure of workers’ confidence in finding better jobs) remain low. These are all telltale signs that the labor market is faltering, contrary to the rosy narratives from some policymakers.
7. Manufacturing is Contracting
The ISM Manufacturing Index came in at 47.2 for August 2024, marking five consecutive months of contraction. New orders hit their lowest level since May 2023, while the employment index, at 46.0, signals that manufacturers are pulling back. Manufacturing is often a leading indicator of broader economic health, and this trend isn’t promising.
We’ve seen the stock market bounce back after last month’s crash, but don’t let that distract you from the bigger picture. The metrics above—commodities, labor market data, bond yields, and central bank actions—tell a far more sobering story. The economy is in trouble, and it’s time to brace for the challenges ahead.
Stay informed, track these key indicators, and don’t let a temporary market rally give you false hope. The road to recovery may be longer than many expect, and we’ll continue to bring you the data and analysis you need to navigate these uncertain times.

While I am neither bearish or bullish, commodities could be setting up for a monster rally in the years ahead as well as the stock markets. Blackrock, state street and vanguard control much of the markets and there is still lots of money sloshing around. Maybe even more if the silly Fed gets silly again and unleashes more money.
Internationally, there is still no better place to put funds into than the US which still offers a good deal of safety and stability. There, of course will be many bumps in the road, but most buyers are of the liberal, democratic or socialist persuasion and they will buy all the angst the fascist government can throw at them.
Forty years ago, it was the republicans controlling much of the wealth. That has completely reversed. The markets are controlled by the globalists and most of them are super rich because they have their wealth in stock shares. They hate it when they lose a penny or two and the average small guy investor will buy anything...as in buying the dips over and over.