

We were told the masking of children was a minor inconvenience. A small ask. Kids are resilient. They’ll be fine.
We never believed it, and we said so at the time — loudly enough that it cost some of us our accounts and a few of us our jobs.
That wasn’t a hunch. It came from four years of hearing the same thing from the same people: from the parents in this community, from the teachers who wrote to us, from speech-language pathologists who described waiting lists they had never seen in twenty-year careers, from the preschool directors who kept saying something is different about this cohort. Anecdote after anecdote after anecdote, from every state, all pointing the same direction, all dismissed as anecdote.
We now have the administrative record. Not a survey. Not a model. The federal count of every child in every state, every year.
It says the people writing to us were right.
The flattest line in the dataset broke
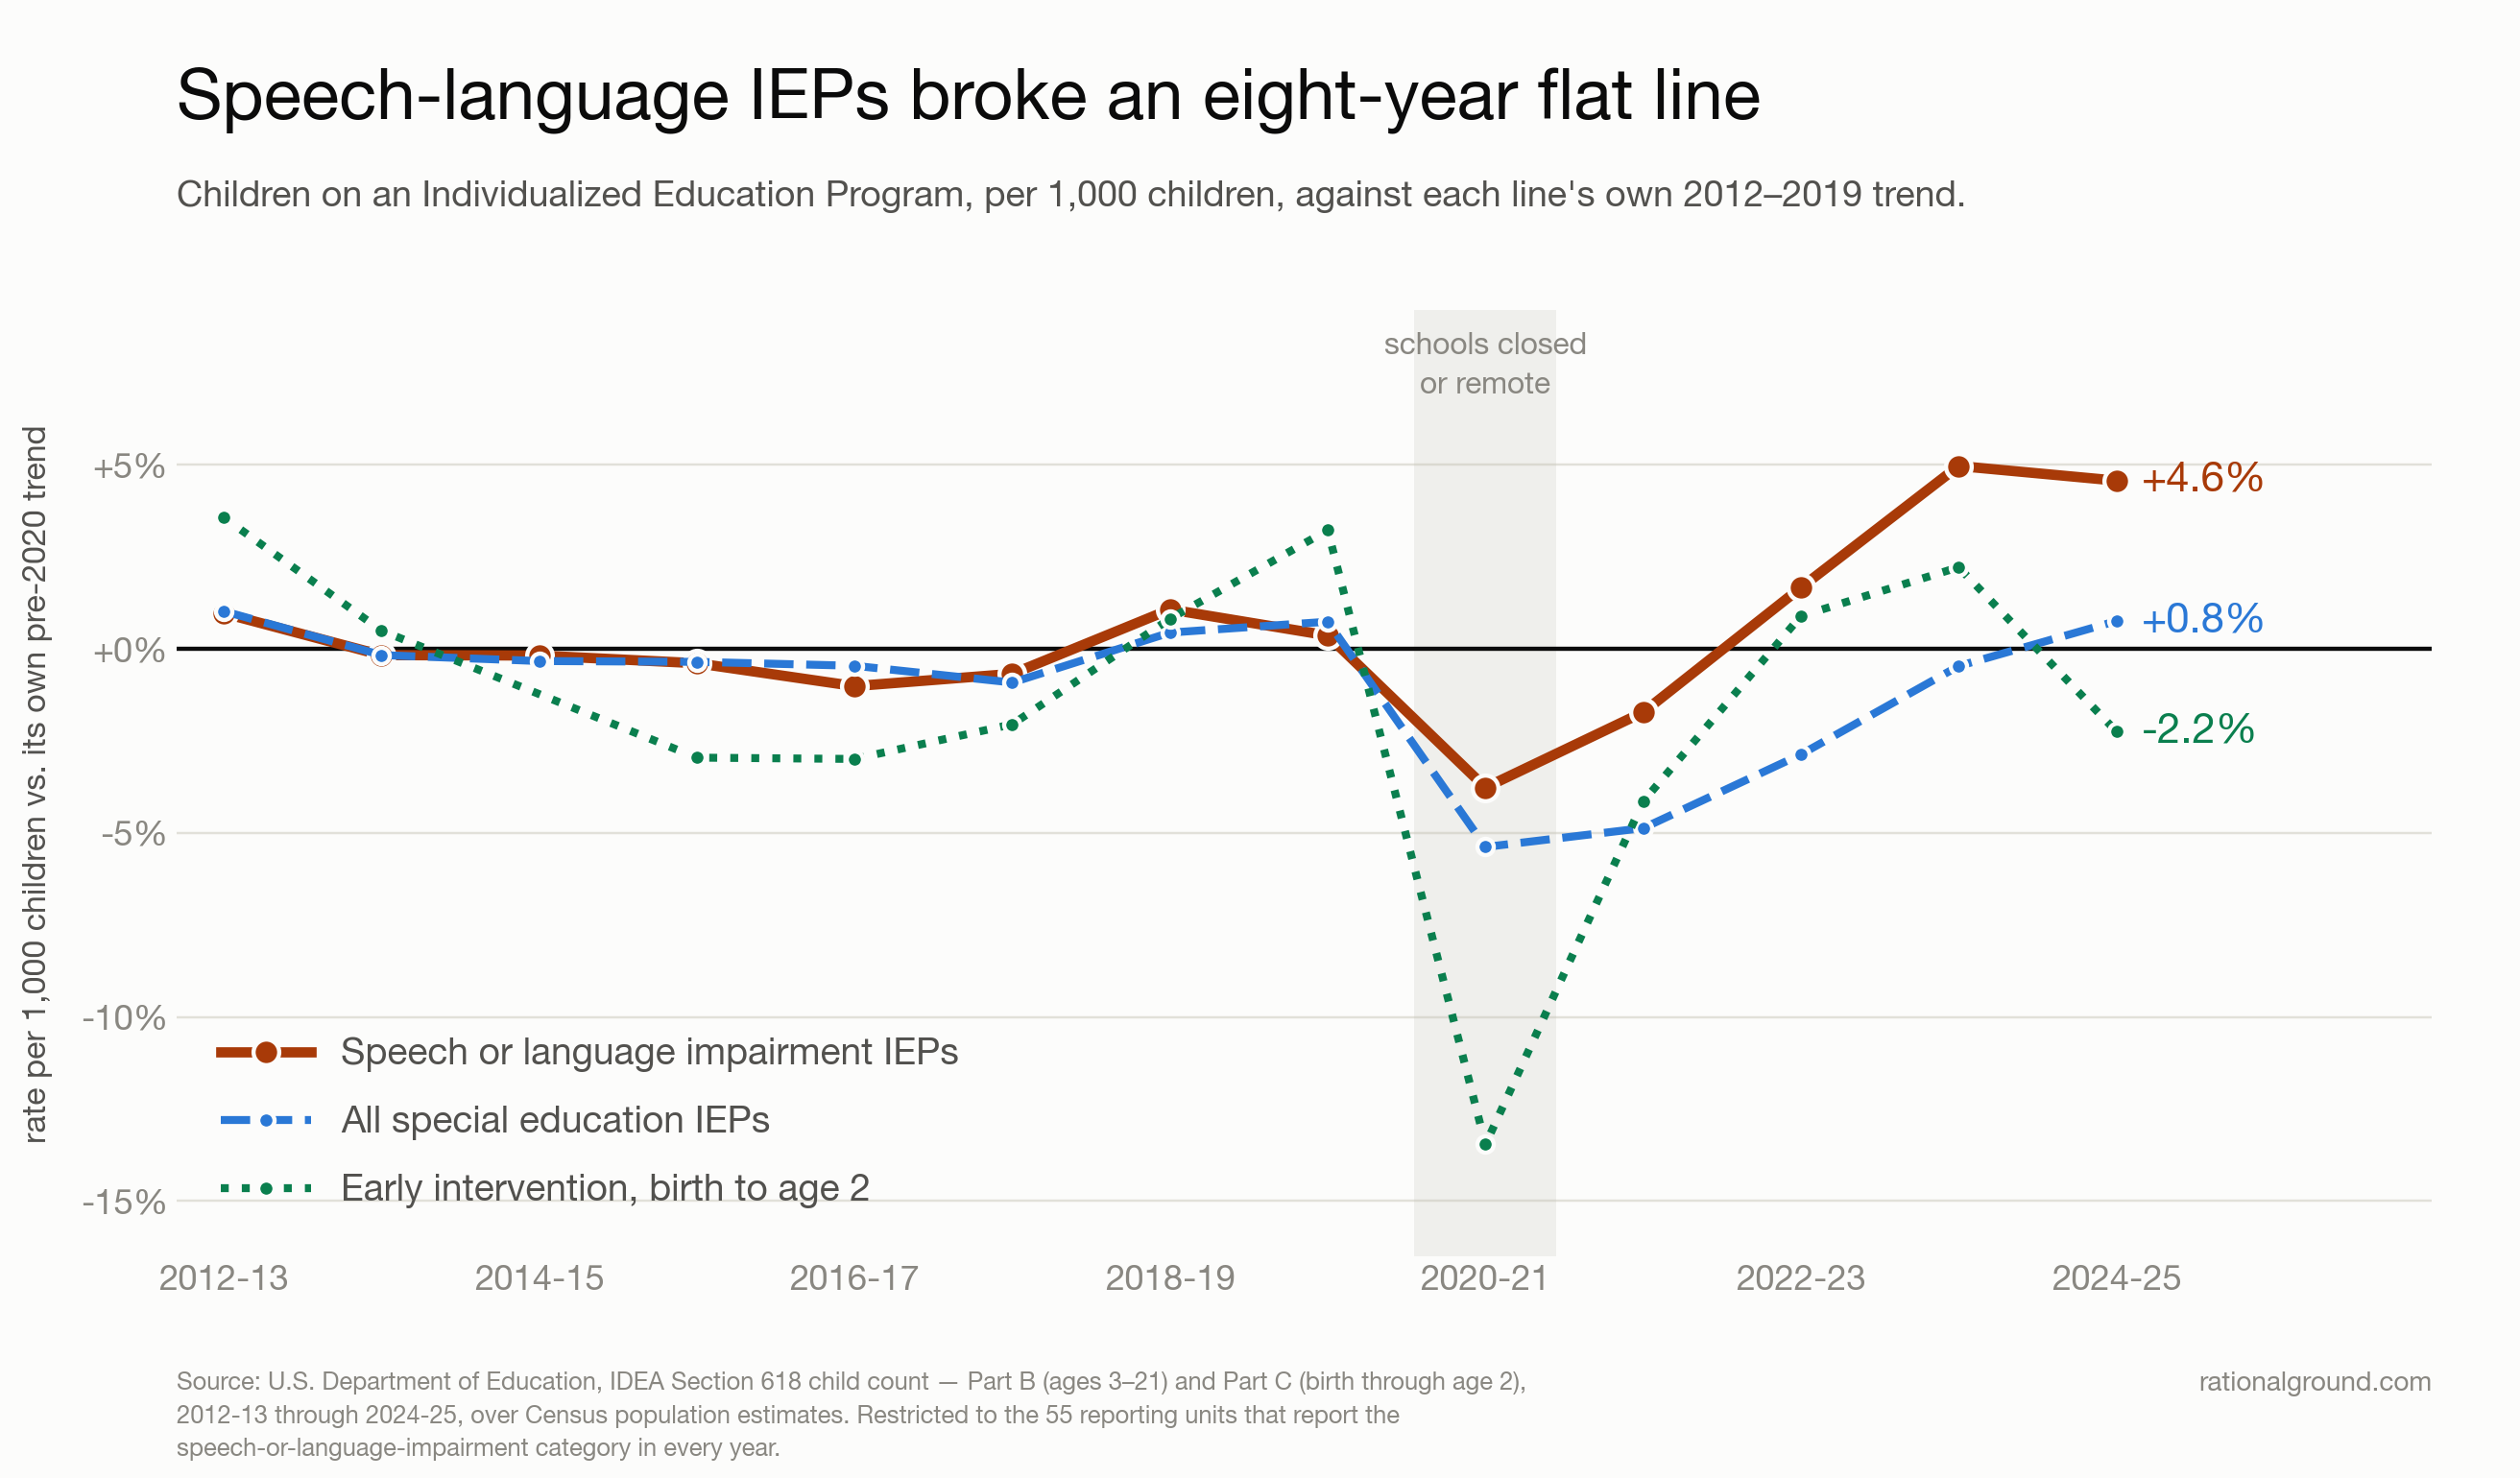
Of everything in the federal special-education file, the steadiest series was speech. For eight consecutive years — 2012-13 through 2019-20 — the rate at which American children were placed on a speech-language IEP sat between 16.74 and 17.24 per 1,000. No trend. No drift. A ruler.
It is now 18.20 per 1,000. The highest in the thirteen years of data that exist. About 5% above where that flat line pointed.
In children rather than rates: 1,352,054 on speech-language IEPs in 2019-20 became 1,454,259 by 2024-25. A 7.6% increase — while the child population was shrinking.
Now the control that turns this from a curiosity into a finding.
All of special education fell during the closure year, and fell harder than speech did — down 5.4%. And it has since climbed back to precisely its own trend: +0.8%. Dead on. Whatever disruption the closures caused to identifying children with disabilities generally, the system absorbed it and returned to baseline.
Speech didn’t return to baseline. Speech overshot and stayed there.
That gap — between the category that recovered and the category that didn’t — is the whole story.
And it tracks how long a state kept masks on children
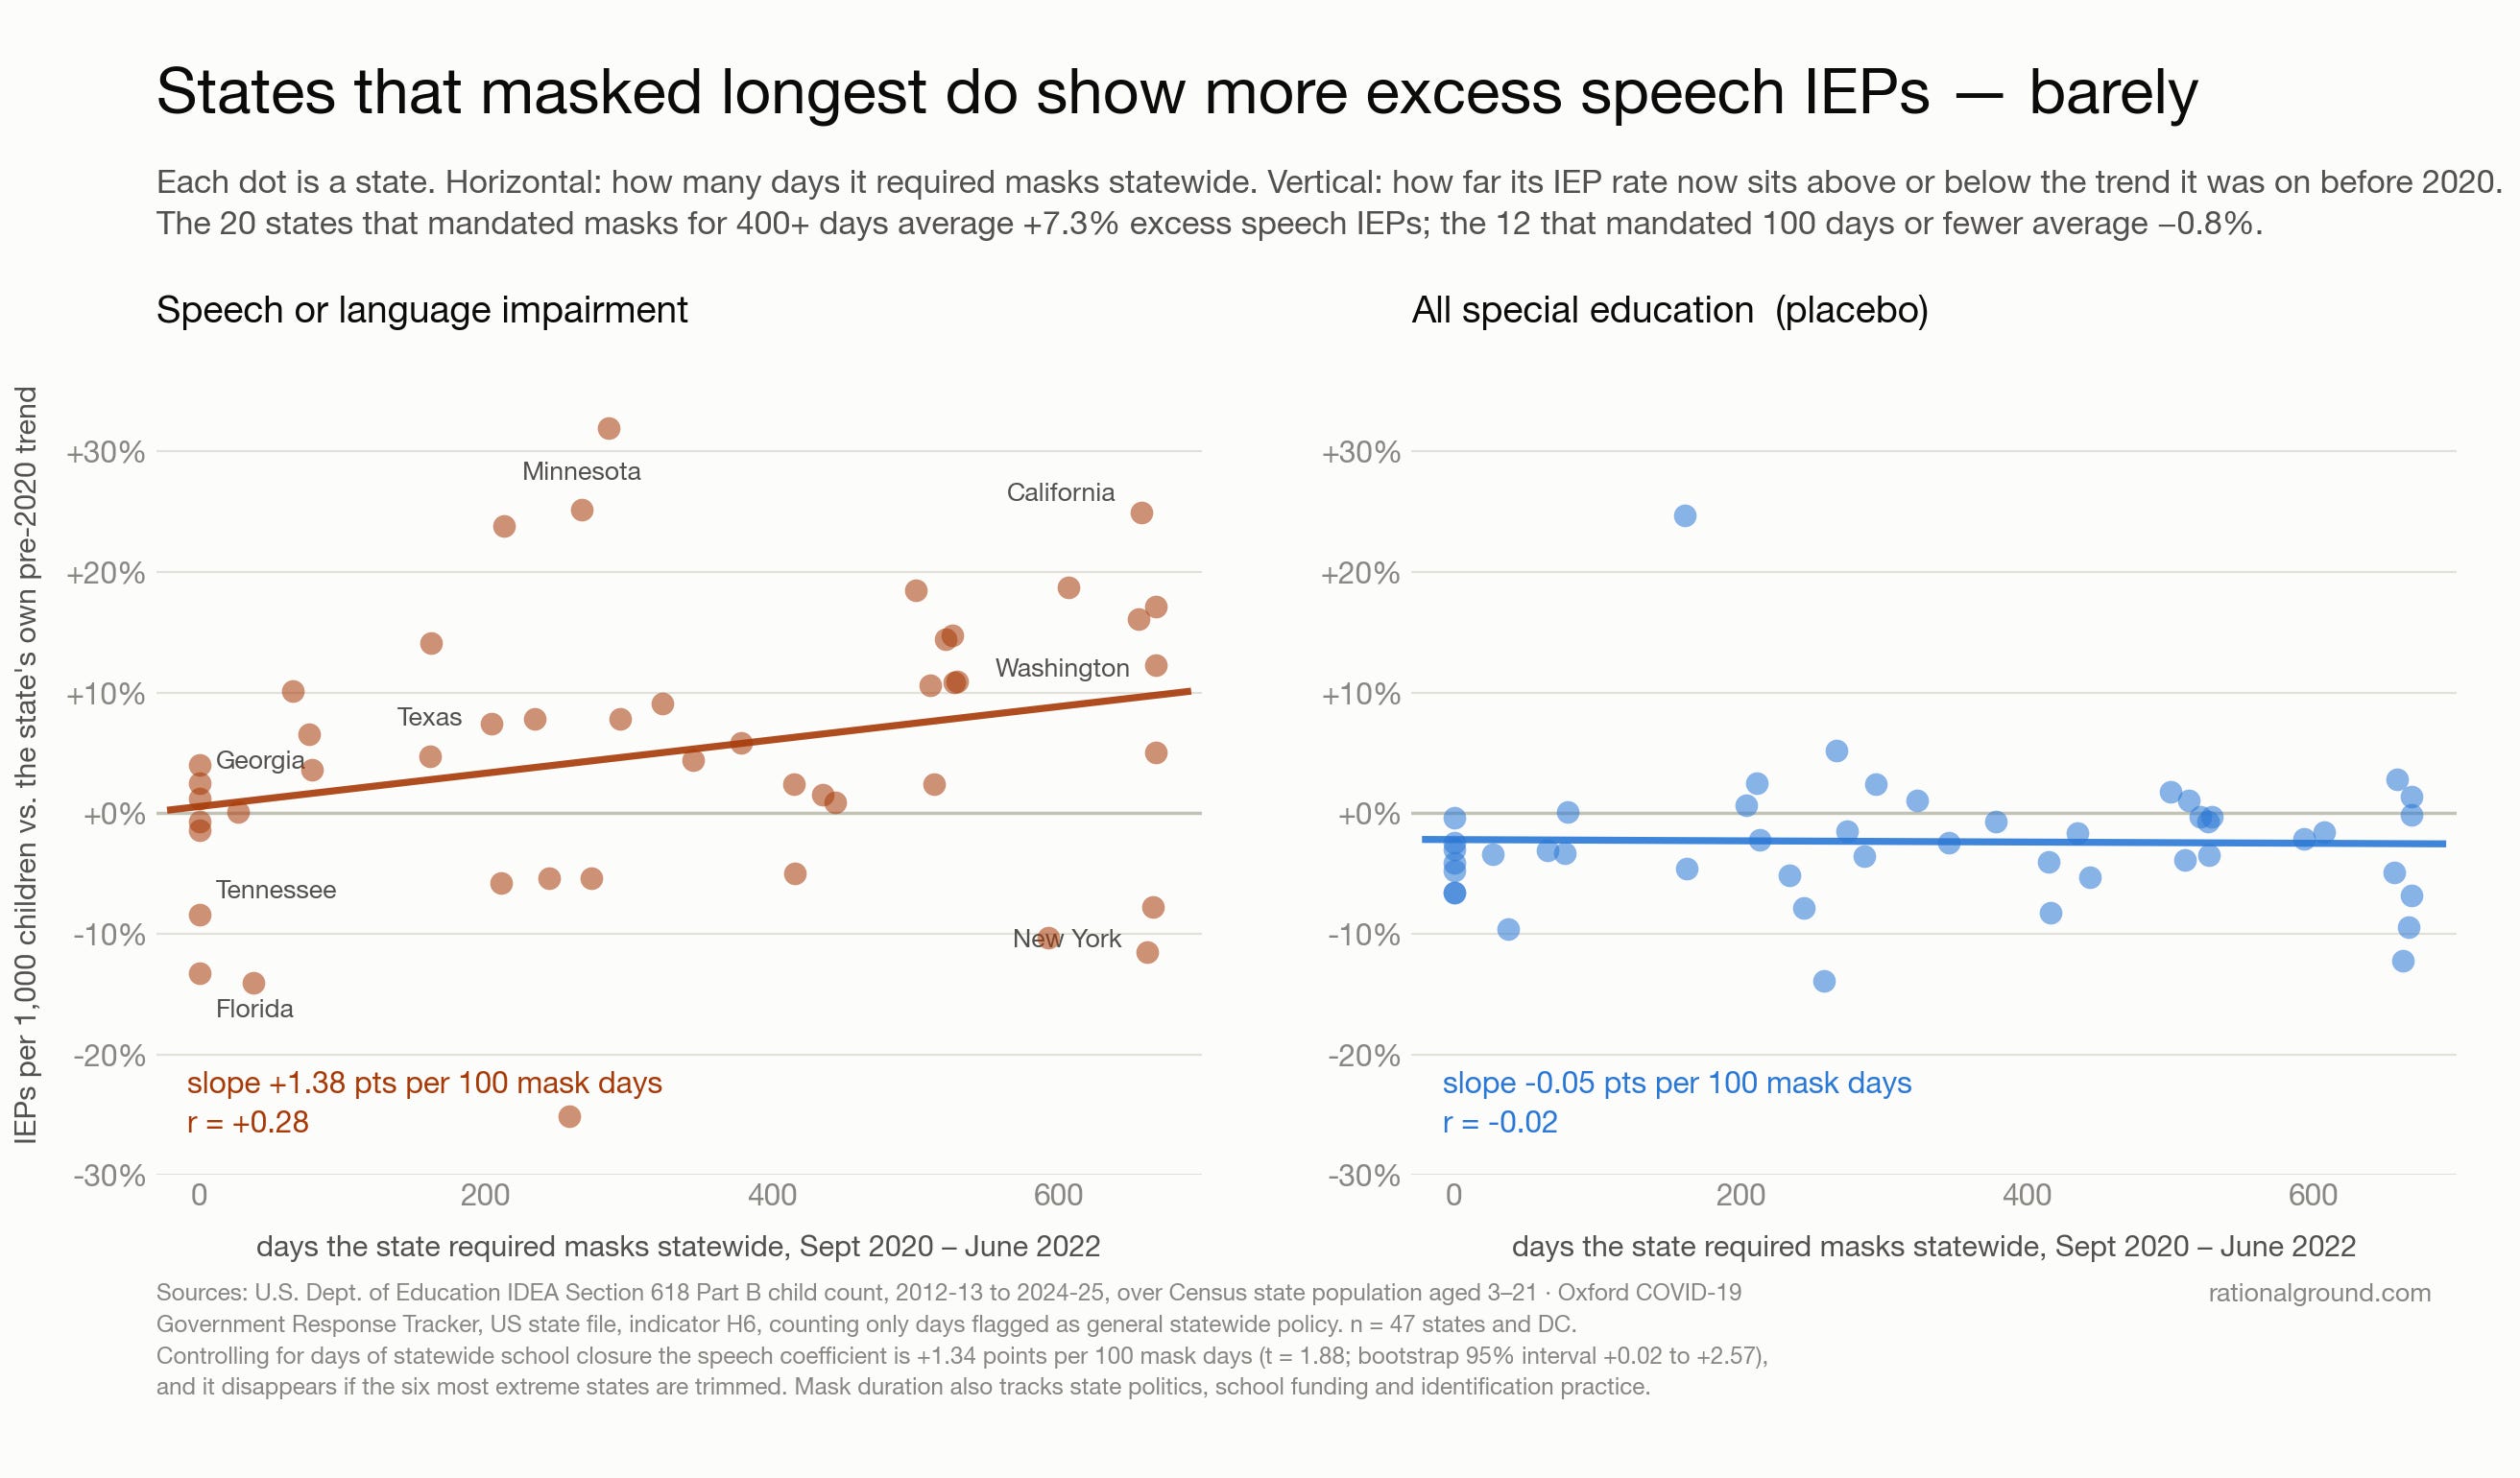
Here is where it stops being just a national curiosity.
Using the Oxford COVID-19 Government Response Tracker, each state was scored on how many days it required masks statewide between September 2020 and June 2022 — counting only genuine statewide mandates, not one county’s rule. The spread is enormous: zero days in Florida, Georgia, Montana, Oklahoma, South Dakota and Tennessee. 668 days — the entire window — in New Jersey, Rhode Island and Washington.
Then: how far does each state’s special-education enrollment now sit above or below the trend that state itself was on before 2020? Every state is measured against its own history. No cross-state comparison of who identifies children more aggressively. Each state is its own control.
For preschoolers — ages 3 and 4:
+2.21 percentage points of excess enrollment for every 100 days of statewide mask mandate. (t = 3.58)
The 20 states that masked 400+ days now average +5.0% above their own pre-2020 trend. The 12 states that masked 100 days or fewer average −9.2% — still below theirs.
A fourteen-point gap.
And it does not break when you push on it. Drop any single state and the coefficient stays between +1.95 and +2.51. Remove the four highest and four lowest states and it holds at +1.61. A bootstrap puts the 95% range at +1.12 to +3.27 — nowhere near zero.
It is not a backlog
The first thing a defender of these policies will say is that long-masking states also closed schools longer, missed more evaluations, and are simply working through a queue.
That was tested. It fails.
How far a state’s preschool enrollment fell during 2020–22 has no relationship whatsoever to how long it masked. +0.24 points per 100 days, t = 0.60. Statistical noise.
Both groups fell into the same hole. Long-maskers dropped 15.3%. Short-maskers dropped 18.3% — further. Then:
Fell 2020–22 Where they are now Masked 400+ days −15.3% +5.0% Masked ≤100 days −18.3% −9.2%
Same hole. Opposite climb.
If this were a backlog clearing, the states that fell furthest would rebound hardest. The correlation runs +0.56 — the wrong sign entirely. The states that fell least came back most.
One more nail: nationally, preschool special education is still cumulatively below its pre-2020 trend. Nobody has finished catching up. The long-masking states are not overshooting a queue. They are on a different road.
It is not missed school either
The second defense: it wasn’t the masks, it was the lost classroom time.
So that was measured properly — not estimated. The COVID-19 School Data Hub recorded what actually happened in 14,921 school districts across 48 states: the share of 2020-21 each district spent in person, hybrid, or fully virtual, weighted by enrollment. Florida lost 3% of the year. Texas lost 11%. California lost 82%. Hawaii lost 83%.
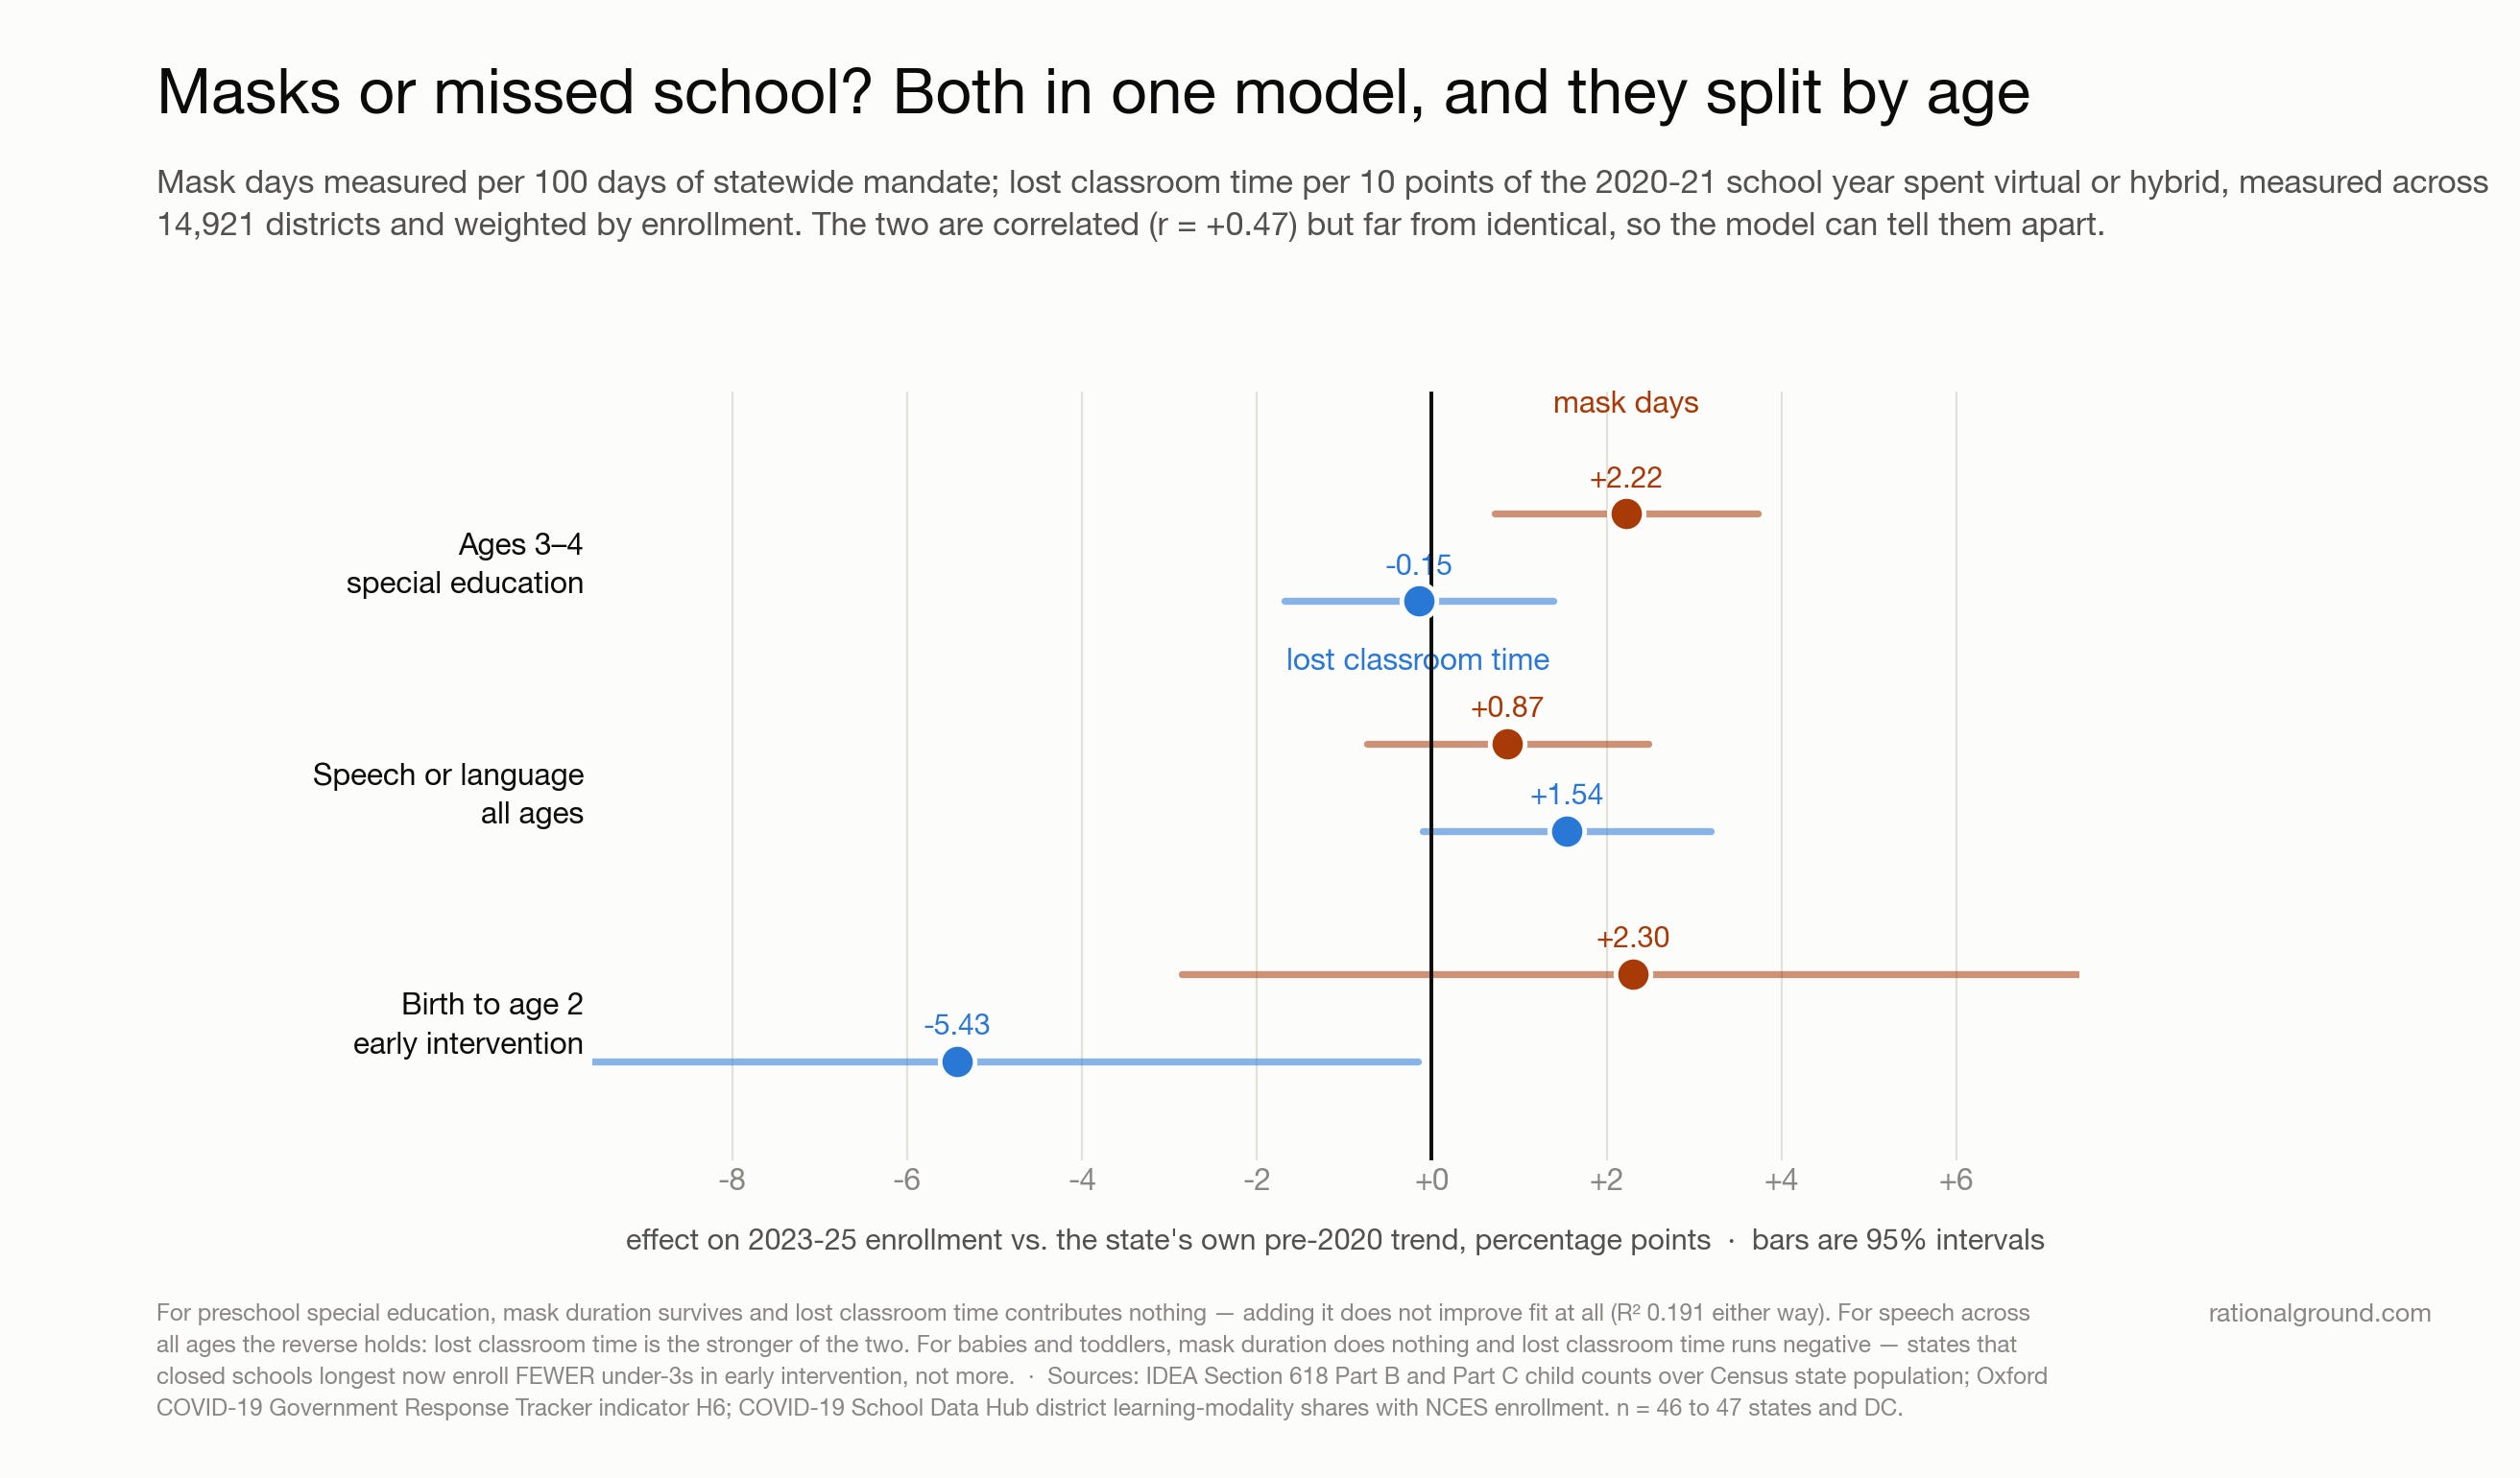
Put both variables in the same model. They’re correlated — r = +0.47 — but nowhere near identical, so the model can separate them.
For preschoolers, it isn’t close:
Mask days Lost classroom time Ages 3–4, special education +2.22 (t = 2.90) −0.15 (t = −0.19)
Adding lost classroom time to the model improves the fit by nothing. The explained variance is 0.191 with it and 0.191 without it.
The leading alternative explanation contributes literally zero.
Mask duration correlates with state politics. State politics also predicts school funding, special-education eligibility rules, and how aggressively districts evaluate children. We cannot rule that out, but we feel confident producing these charts as proxy data for what we already knew: masking kids was a bad idea.
One more number, from the American Speech-Language-Hearing Association: 69% of speech-language pathologists reported increased referrals since 2020. They didn’t need our regression. They were living in it.
We should never have had to prove this. But here it is.
All figures are from federal administrative records, reproducible from public sources. Special education counts: U.S. Department of Education IDEA Section 618 child count, Part B (ages 3–21) and Part C (birth–2), 2012-13 through 2024-25, restricted to the 55 reporting units present in every year. Population denominators: U.S. Census Bureau state estimates by single year of age. Mask policy: Oxford COVID-19 Government Response Tracker, indicator H6, statewide-general days only. Learning modality: COVID-19 School Data Hub, 14,921 districts across 48 states. The ages 3–4 measure covers all disabilities — the federal file has never published the speech category by single year of age. IEP counts are a record of what school systems did, not a direct measure of children; that is the nature of the source and we present it as such.
Many, if not most, of the policies deployed during the covid dumpster fire simply upset or disappointed me on a personal basis. For example, having to wear a mask to ride mass transit or shop at the grocery store was inconvenient and I knew it was also stupid. This data is different. It's heartbreaking in the most visceral way. The people who we should have been protecting and supporting, children, will bear the burden of dumbassery thrust upon them by fearful (and in some cases, corrupt) adults. There is probably a more nuanced and thoughtful way I could respond, but I cannot think of it right now. Damn.
Does anyone remember their local, state or national SLT programs speaking up n defense of the kids they serve? One of the biggest disappointments was being completely abandoned by the ‘professionals’ who should have known better and I thought were in my corner regarding SPED. SLTs totally failed.